Weather, Additional Issues Lead to 3.2 Percent Decline in Construction Backlog Indicator
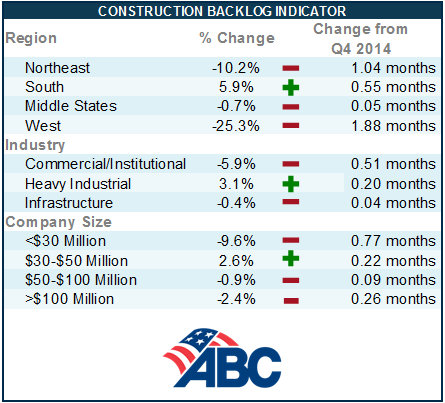
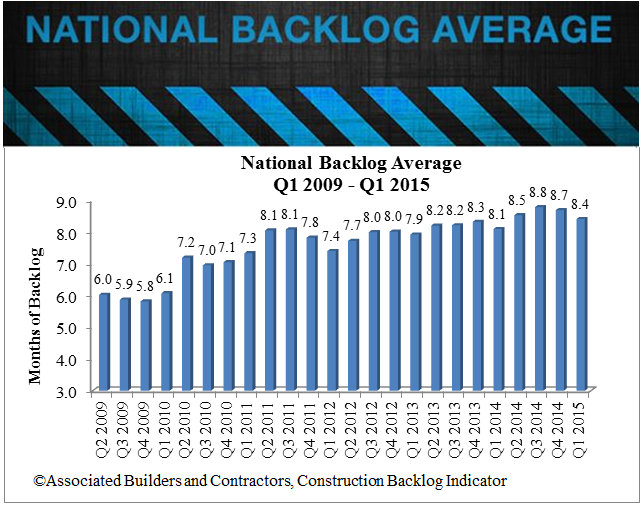
Associated Builders and Contractors’ (ABC) Construction Backlog Indicator (CBI) declined 3.2 percent during the first quarter of 2015. Construction firms report a revenue-weighted average CBI of 8.4 months, 0.3 months below the fourth quarter of 2014 reading. Year over year, CBI has increased 4 percent from the first quarter of 2014 backlog of 8.1 months.
“Weather and a myriad of other factors always make the first quarter CBI difficult to interpret,” said ABC Chief Economist Anirban Basu. “A brutal winter may have postponed project-related work, including the signing of contracts. The first quarters of 2012 and 2014 also experienced CBI declines that effectively were reversed during the ensuing second quarters.
“However, there is a reason to believe seasonal forces were not the only factor in reducing CBI,” Basu said. “Sharp reductions in oilfield investment impacted a number of companies in the Middle States, while firms in the West appear to have been disproportionately impacted by the West Coast port slowdown. Weather and the port slowdown represent temporary factors, implying that backlog should re-establish an upward trajectory during the months to come.
“Construction was hardly the only segment of the economy to be impacted by weather, labor disputes and lower energy prices,” said Basu. “The entire macro-economy failed to expand during the year’s initial quarter. Still, economic fundamentals remain relatively strong. Job growth continues to expand, unemployment is below 6 percent and wage gains are steadily building. With fuel prices still low, consumer spending is positioned to remain the primary driver of economic expansion. Residential construction also has picked up in recent months, with even the single-family market showing signs of life.”
Regional Commentary
It appears that the impact of the West Coast port slowdown was far greater than most economists imagined. While the West Coast ports play a significant role nationally, they are of particular importance to regional markets such as Los Angeles, Seattle and San Francisco. Contractors in these areas reported sharply softer backlogs during the first quarter, particularly among large commercial construction firms that depend heavily on the delivery of materials coming from abroad. This is likely to be reversed during the second quarter, at least in part. The presumption is that many ongoing construction projects in the West will be delivered behind schedule due to unavoidable supply chain interruptions.
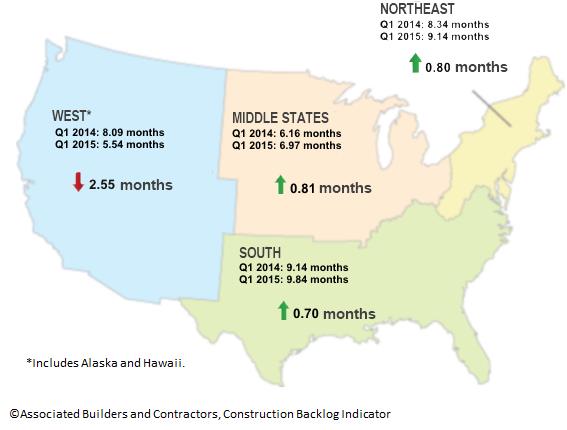
In the balance of the country, CBI is above its year-ago level. For instance, in the Northeast, CBI stands at 9.1 months, up from 8.3 months at the same time one year ago. In the South, CBI stands at 9.8 months, up from 9.1 months. In the Middle States, CBI stands at 7 months, up from 6.2 months.
Regional Highlights
- Were it not for the West, overall CBI would have actually increased during the first quarter.
- Backlog in the South, which is now adding more jobs than any other region of the country, is at the highest recorded level for the region in the history of the series.
- Forward-looking construction indicators have not deteriorated in the Middle States despite a general decline in commodity prices during the past year.
Year-Over-Year CBI Map of Regions and Backlog Months
First Quarter 2014 v. First Quarter 2015
Industry Commentary
Of the three construction industry segments monitored by ABC, only the commercial/institutional category has experienced declining backlog during the past year. During the first quarter of 2014, CBI in the commercial/institutional category stood at 8.4 months; one year later it stood at 8.2 months. The most interesting aspect of this quarter’s CBI release is the ongoing recovery of the heavy industrial segment. Low fuel prices may be prompting more manufacturers to expand, which has translated into a backlog now at 6.8 months. This is well above the 5.1-month average recorded during the initial quarter of 2014.
Industry Highlights
- Despite a stronger U.S. dollar and weak export growth, CBI in the heavy industrial segment established a new high for the series during 2015’s initial quarter.
- Firms involved in the infrastructure segment also continue to get busier. Despite the impact of winter weather, backlog remained essentially unchanged during the first quarter compared to the end of 2014, and is up by nearly two months during the past year (to an average of 10 months).
- Given expected levels of consumer spending during the second quarter of 2015 and beyond and ongoing employment growth in professional services, health care, hospitality and financial services, the expectation is that backlog expansion in the commercial/institutional segment will resume during the months ahead.
Company Size Commentary
On a quarterly basis, three of the four firm size categories that ABC tracks sustained a decline in average backlog. The impact of policy is also evident. The nation is not experiencing a wave of large-scale infrastructure investment presently, in part because of constraints on federal spending. However, many state and local governments have begun to increase their infrastructure spending, particularly on roads and bridges. These projects tend to invite the participation of firms in the $30 million to $50 million annual revenue category, or at least this is what the CBI survey results indicate. This is the only group for which backlog increased during the past year, with many of these firms indicating that infrastructure spending has been a source of expanding business for them.
Highlights by Company Size
- Backlog declined across all firm sizes except for those with annual revenue between $30 million and $50 million on a quarterly basis.
- On a year-over-year basis, firms with annual revenue below $30 million experienced a slight increase in average backlog, from 7.2 months to 7.3 months.
- The largest firms have sustained a loss in average backlog during the past year, from 11.7 months to 10.4 months. These are the firms most likely to be impacted by the slowdown in oil patch spending.
Note: The reference months for the Construction Backlog Indicator and Construction Confidence Index data series were revised on May 12, 2020. All previously reported quarters and months shifted forward by one period to better reflect the timing of when the surveys were conducted.