Private Construction Industry’s Importance to State Economies
This article is an update to The Importance of Construction to State Economies.
Executive Summary
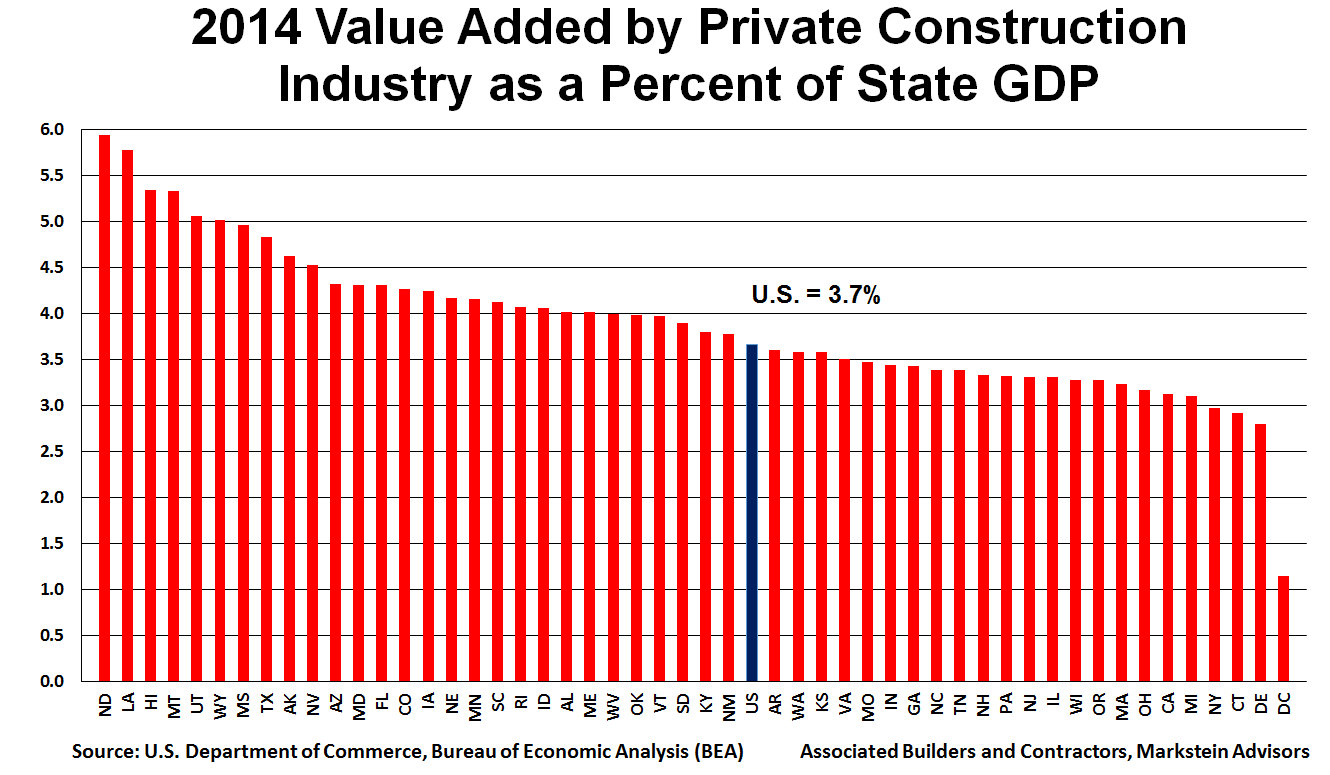
Over the last 18 years, the value added by the private construction industry as a percentage of real (inflation-adjusted) national gross domestic product (GDP) declined from a high of 6.17 percent in 1997 to a low of 3.66 percent in 2014 (the latest year for which annual data are available). Prior to 2014, the previous low percentage of GDP for the construction industry was 3.7 percent in 2011, inching up to 3.77 percent in 2012 and 2013 as both economic and construction activity increased.
Although not included in these figures, the U.S. economy also benefits from purchases related to construction projects, such as equipment for a new factory, furniture for an office or residential property, and appliances for commercial and residential units. These additional purchases add at least 2 percent to 3 percent to the impact of the construction industry on the economy.
View the breakdown of construction's contribution to GDP per state.
In 2014, the top five states for construction as a percentage of state GDP in order from highest to lowest were:
1. North Dakota
2. Louisiana
3. Hawaii and Montana (tie)
5. Utah
Although lower energy prices have taken their toll on some of these states, the boom in energy helped put North Dakota at the top of the list in 2013 and 2014. The top ranking for 2013 is based on revised GDP data (North Dakota was tied with Louisiana for third based on preliminary data). Due to data revisions, Mississippi fell from its original top spot to fifth in 2013. In 2014, it slipped to number seven.
Louisiana, Montana and Utah also benefited from the energy boom. These three states, along with Hawaii, saw a boost from tourism-related construction as well. Further, housing construction played a role in the construction activity for these states.
The bottom five states (excluding the District of Columbia) in 2014 for construction as a percentage of state GDP from highest to lowest were:
46. California and Michigan (tie)
48. New York
49. Connecticut
50. Delaware
The bottom two states fell slightly below 3 percent. New York was at 3 percent, while the rest of the states were higher. Fewer than half of the states (22 states plus the District of Columbia) fell below the U.S. average of 3.7 percent. The state with the lowest construction percentage, Delaware, was less than 1 percent below the national average contribution to GDP for the industry, indicating that construction plays an important role in states’ economies, even in states deriving a below-average boost from construction.
View the top and bottom 10 states
Outlook for the Economy and Construction
The economy advanced with fits and starts throughout 2014. Every time the data suggested the economy was finally picking up speed, it was followed by numbers indicating that the economy had stumbled. On a year-over-year basis, real GDP increased 2.4 percent in 2014 compared to 1.5 percent in 2013.
Even with stronger growth in the national economy, 2014 proved to be a more difficult year for construction than most forecasters expected. Despite some bright spots, the value added by the private construction industry fell in real terms in 2014.
Looking ahead, the U.S. economy is likely to perform somewhat better in 2015 than in 2014, which will benefit the U.S. construction industry.
Background on Construction and the Economy
As noted in The Importance of Construction to State Economies, the importance of the construction industry to the national and state economies stretches beyond the direct impact of construction activity. The U.S. economy benefits from purchases related to, but not directly included in, construction projects, such as equipment for a new factory, furniture for an office or residential property, and appliances for commercial and residential units. Based on conservative estimates, these additional purchases add at least 2 percent to 3 percent to the impact of the construction industry on the economy.
From 1997 to 2014 (the latest year for which annual data are available), the value added by the private construction industry as a percentage of real (inflation-adjusted) national gross domestic product (GDP) declined from a high of 6.17 percent in 1997 to a low of 3.66 percent in 2014. Prior to 2014, the previous low was 3.7 percent in 2011. The economy had been slowly recovering from its 2011 nadir, inching up to 3.77 percent in 2012 and 2013 as both economic and construction activity increased. It is clear that although construction remains important to the economy, it continues to struggle to recover from the Great Recession, even five years into the recovery.
Construction and State Economies
The relative impact of the private construction industry on various state economies varies dramatically both among states in a particular year and within a state over time. It has ranged from a high of 14.8 percent of state GDP in Nevada in 1997 to a low of 2.8 percent in Delaware in 2014 (excluding the District of Columbia, which derives a much lower benefit from its construction industry than the states). The variation in this ratio for a state over time can be dramatic, as demonstrated by Nevada, which had a peak of 14.8 percent in 1997 and dropped to a low of 4.3 percent in 2012.
View states based on their change in construction industry contribution to GDP from 2013 to 2014.
Top Five States
In 2014, the top five states for construction as a percentage of state GDP in order from highest to lowest were:
1. North Dakota
2. Louisiana
3. Hawaii and Montana (tie)
5. Utah
Although lower energy prices have taken their toll on some of these states, the boom in energy helped put North Dakota at the top of the list in 2013 and 2014. The top ranking for 2013 is based on revised GDP data (North Dakota was tied with Louisiana for number three based on preliminary data). Due to data revisions, Mississippi fell from its original number one spot to number five in 2013. In 2014, it slipped to number seven.
Louisiana, Montana and Utah also benefited from the energy boom. These three states, along with Hawaii, saw a boost from tourism-related construction as well. Further, housing construction played a role in the construction activity for these states.
Louisiana held on to its number two position from 2013 based on revised data. Hawaii and Montana tied for third place in 2014—a repeat of their 2013 rankings based on revised data (preliminary data ranked Hawaii number two and Montana number five in 2013). Utah moved up to fifth place in 2014. It was tied for sixth with Wyoming in 2013 based on revised data (preliminary data listed Utah in seventh place and Wyoming tied for ninth with Nevada). Wyoming held on to sixth place in 2014, tied with Mississippi.
View states grouped by region.
Bottom Five States
The bottom five states (excluding the District of Columbia) in 2014 from highest percentage of state GDP to lowest were:
46. California and Michigan (tie)
48. New York
49. Connecticut
50. Delaware
The bottom two states fell slightly below 3 percent. New York was at 3 percent, while the rest of the states were higher. Fewer than half of the states (22 states plus the District of Columbia) fell below the U.S. average of 3.7 percent. The state with the lowest percentage, Delaware, was less than 1 percent below the U.S. average, indicating the importance of the construction industry for all states—even those deriving a below average boost from construction.
Delaware, Connecticut and Michigan also were among the bottom five states in 2013. Delaware, a small state, held on to the position of lowest percentage of state GDP derived from the construction industry. However, size is not the only determinant of the impact of construction on a state’s economy, as even tinier Rhode Island ranked 14th highest in 2013, tied with Oklahoma, South Carolina, Florida and Idaho, and tied with South Carolina and Idaho for 18th highest in 2014.
Connecticut held on to its second lowest position from 2013. New York took sole possession of third lowest position from being tied with Michigan in 2013 based on revised data (preliminary data ranked New York as sixth lowest, tied with California). Michigan moved up to tied for fourth lowest in 2014 (preliminary data had placed Michigan in a tie with Connecticut as second lowest).
California tied for fourth lowest with Michigan in 2014 after being tied with Ohio for fifth lowest in 2013 based on revised data. Preliminary data for 2013 had the state tied with New York for sixth lowest.
Ohio was tied with Massachusetts for sixth lowest in 2014 after being tied with Oregon for fourth lowest in 2013 based on preliminary data, and tied with California for fifth lowest based on revised 2013 data. Revised data for 2013 moved Oregon from tied with Ohio for fourth lowest to a tie with Illinois, Massachusetts and Wisconsin as seventh lowest (41st highest). In 2014, Oregon tied with Illinois, New Hampshire, New Jersey, Pennsylvania and Wisconsin as eighth lowest (or 38th highest).
View states' 2013 output based on original and revised data.
Outlook for the Economy and Construction
The economy advanced with fits and starts throughout 2014. Every time the data suggested the economy was finally picking up speed, it was followed by numbers indicating that the economy had stumbled. On a year-over-year basis, real GDP increased 2.4 percent in 2014 compared to 1.5 percent in 2013.
Even with this stronger growth in the national economy, 2014 proved to be a more difficult year for construction than most forecasters expected. Despite some bright spots, the value added by the private construction industry fell in real terms in 2014.
Among the bright spots were lodging, office and (surprisingly) retail construction. Manufacturing construction was also strong. Construction of new residential buildings showed healthy gains for the third year in a row, though from a low base. Multifamily construction has largely returned to normal, while single-family housing construction remains well below normal.
So far this year, despite a weak first quarter, the U.S. economy has continued to advance at a solid rate with improved gains in employment. As a result of the strengthening economy, the Federal Reserve is expected to initiate its first interest rate increase in nine years before the end of 2015.
Inflation remains subdued for the economy as a whole and for inputs to construction. Although some construction materials prices have increased faster than general inflation, these cost increases have been more than offset by lower energy prices. Even with the recent rebound, energy prices remain well below their year-ago levels.
Energy prices are likely to remain around their current levels for the rest of this year and well into 2016. Higher energy and building materials prices will most likely be the result of improved economic activity in the United States and abroad. That will be more of a positive for construction than the negative impact from higher input prices.
Meanwhile, lower energy prices have slowed investment in exploration and new production for oil and natural gas. This has adversely affected equipment suppliers to these industries. At the same time, the slowdown in exploration has increased the availability of skilled construction workers, particularly heavy equipment operators, who were formerly employed in the energy sector.
Lower energy prices have benefited many manufacturers and aided consumers’ budgets. Initially, consumers used the reduced spending on energy to bolster their savings. But now there is evidence that consumers are slowly increasing their spending, which is benefiting the economy. The increased demand for consumer goods and services translates into increased demand for plants and equipment to produce and deliver consumer goods and services (e.g., office space, lodging, health care facilities).
Another positive is the steady advance in employment. Despite the harsh winter, in the first half of 2015, nonfarm payroll employment increased an average of a little over 200,000 jobs per month. This has meant increased income for those who were able to turn part-time work into full-time work and for those who moved from being unemployed to being employed. An improving job market also allows some workers to move to higher paying jobs or receive a pay increase.
These individuals and their families spend more, creating a virtuous cycle. The healthier jobs market and the resulting increased income and implicit greater job security encourages some households to move ahead with plans to purchase their first house or to move to a more expensive house. A small percentage (but increasing number) of these households will purchase a newly constructed house, bolstering demand for single-family residential construction.
However, a number of factors are acting as a drag on the housing market, preventing a faster recovery for this sector. These include still abnormally strict lending standards despite some loosening during the last year or so, many who cannot qualify for a mortgage due to recent bankruptcy or foreclosure, significant student debt for a portion of the population that makes up a large percentage of first-time buyers, shortages of some skilled construction workers, and simple fear of home ownership among many renters. Thus, construction of single-family homes, although increasing over time, will continue to be below the nation’s long-run needs.
The healthier job market also spurs demand for rental properties as the newly employed and those with increased income move out of shared living arrangements. This will sustain the current level (and within reason, a higher level) of multifamily construction. Rising rents are helping keep these new multifamily projects profitable. If there is any area of concern in the multifamily universe, it is that too many high-end luxury multifamily projects are moving forward at the expense of more affordable units, where most of the demand growth is concentrated.
Expect residential construction (both single-family and multifamily) to increase this year and in 2016. Single-family construction will post healthy percentage gains, but still from a relatively low base. Single-family construction will remain well below the nation’s long-term needs.
Outlook for Government Infrastructure Projects
While there appears to be a consensus in Washington regarding the pressing need for investment in U.S. infrastructure, little has been accomplished on this front beyond talk. Opposition to raising taxes, even for badly needed infrastructure projects, remains strong. Public-private partnerships have partially filled the gap, but have been found wanting in many cases.
Although the private sector can be expected to invest in infrastructure (e.g., power, communications), the outlook for government investment in infrastructure looks bleak at this point. Total investment in infrastructure is likely to decline this year and only advance somewhat faster than inflation next year.
Risks to the Forecast
There are risks to the somewhat positive economic forecast.
- Developments in Europe, particularly with regard to Greece, present the biggest unknowns and biggest risks at present. Slower growth in Europe, including recession in some countries, has already had a negative impact on U.S. exports. Turmoil in the European Union helps no one, although Greece has, and will continue to, absorb most of the pain. A Greek exit from the euro (either voluntary or involuntary) will affect questions about the viability of the euro. Financial markets are not happy with these developments, which is likely to be a drag on world growth. There are many unknowns on this front, but most lenders are prepared for a Greek default.
- A slower growing Chinese economy is another negative and risk for both the U.S. and global economies. China is clearly struggling with various economic problems; the most pressing of which is deflation of a Chinese stock market bubble. A relatively small percentage of Chinese people have been involved in their stock market, so the direct economic impact will be minor. However, steps taken by the Chinese government to tame the stock market could have other adverse effects on their economy. Meanwhile, the political impact could prove to have unpredictable consequences. With China controlling its economic data with little transparency, economists question the accuracy of those numbers. As with Europe, U.S. exports to China are important and have been adversely affected. The full impact of economic developments in China remains a risk to U.S. growth forecasts.
- Energy prices, as always, can move sharply in either direction over a short period of time, causing disruptions to the economy. At this point, an upward movement in prices is more likely.
- The Federal Reserve is expected to begin raising interest rates before the end of the year. Given that the markets anticipate this move, the impact on financial markets and economic activity is likely to be minor. However, should the Fed increase rates rapidly over a relatively short period of time, as opposed to its current indication of slow, limited increases, the economy would be severely negatively affected. The probability of this outcome is very low.